Historical data that doesn’t hide the leak
The app for SENKO’s fixed gas detectors (SI-200, SI-301) showed only live readings, so safety engineers could not look back at what happened overnight. I wrote a proposal and built a working prototype that puts history first, around the question an engineer asks: did anything cross the alarm line, and when?
Role Problem framing, proposal, UX and a React prototypeResult Delivered with several other proposals; the manufacturer took it back to consider
An average can hide a leak
A day of one-second readings is 86,400 points; a phone screen fits about a hundred. In the 24-hour view I averaged 900 samples into each of 96 points, and the chart says so. Each point also carries the interval’s maximum, drawn as the top of a shaded band, so a short spike stays visible when the average is low.
Switch to averages only to see what they hide.
Averages only: the day looks quiet. Nothing crosses the line.With the band: a 75-second leak just after 14:20 reaches 186 ppm.
A generated day with one short leak, aggregated the way the prototype does it. The line follows each average; the band runs from minimum to maximum. The alarm line is an example.
The alarm line is part of the chart
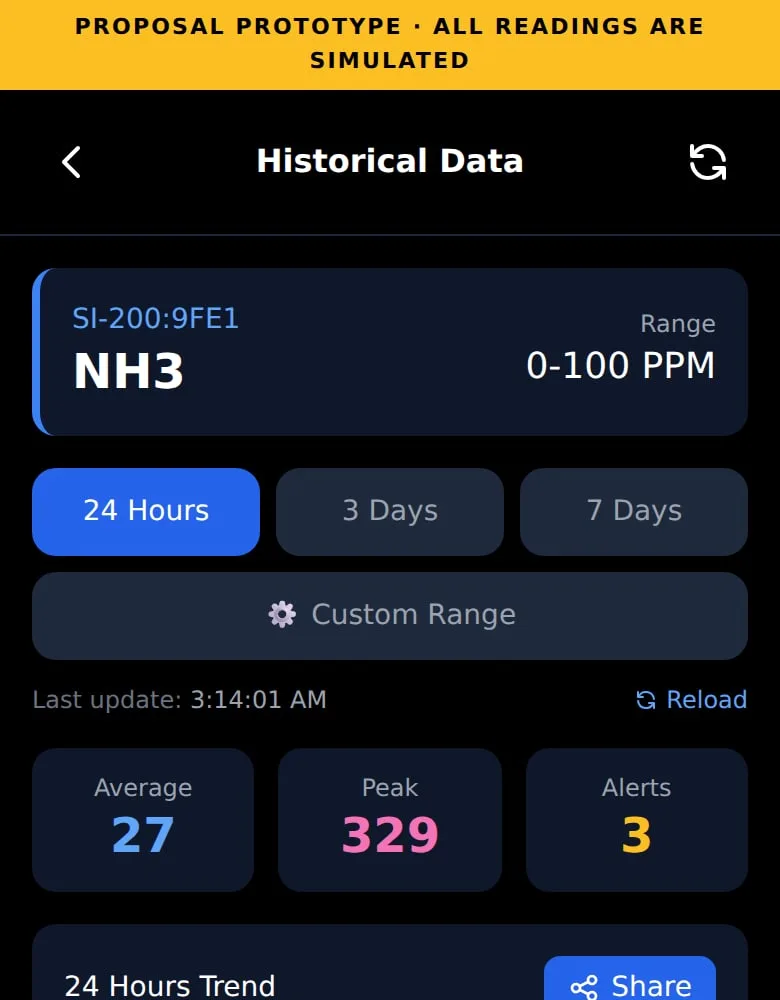
I drew the alarm threshold on the chart, marked every reading above it, and put the average, peak and alert count in the header.
To reach it in the prototype: Manage Fixed Device → SI-200 → a device → the menu at the bottom right → History.
Every range uses the same layout
24 hours, 3 days, 7 days and a custom range share one layout. Only the aggregation interval changes (15 minutes, 1 hour, 2 hours), and the chart states which one it uses.
Fewer steps for routine work
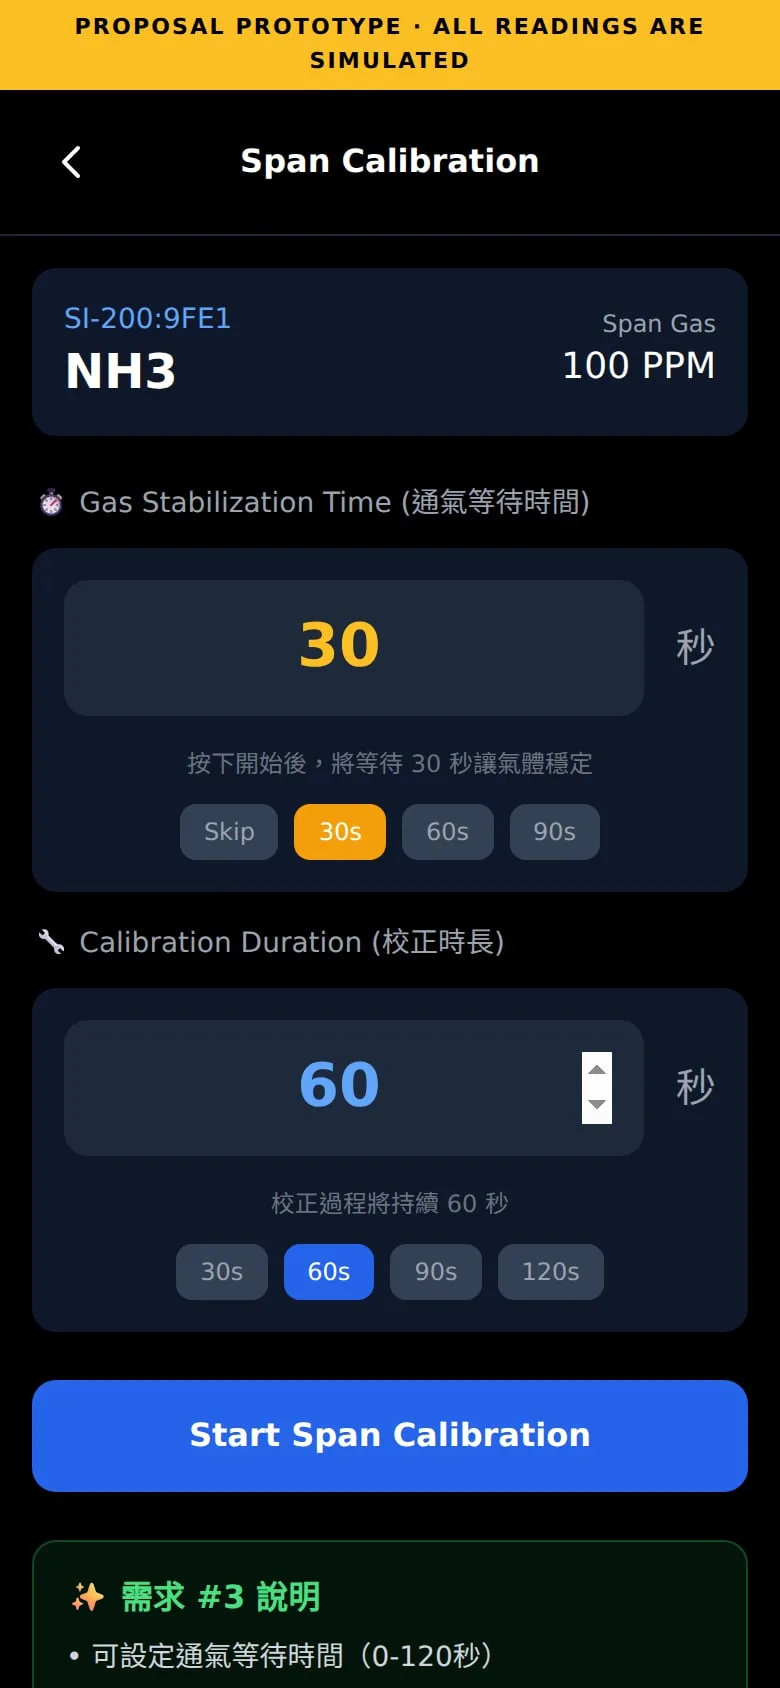
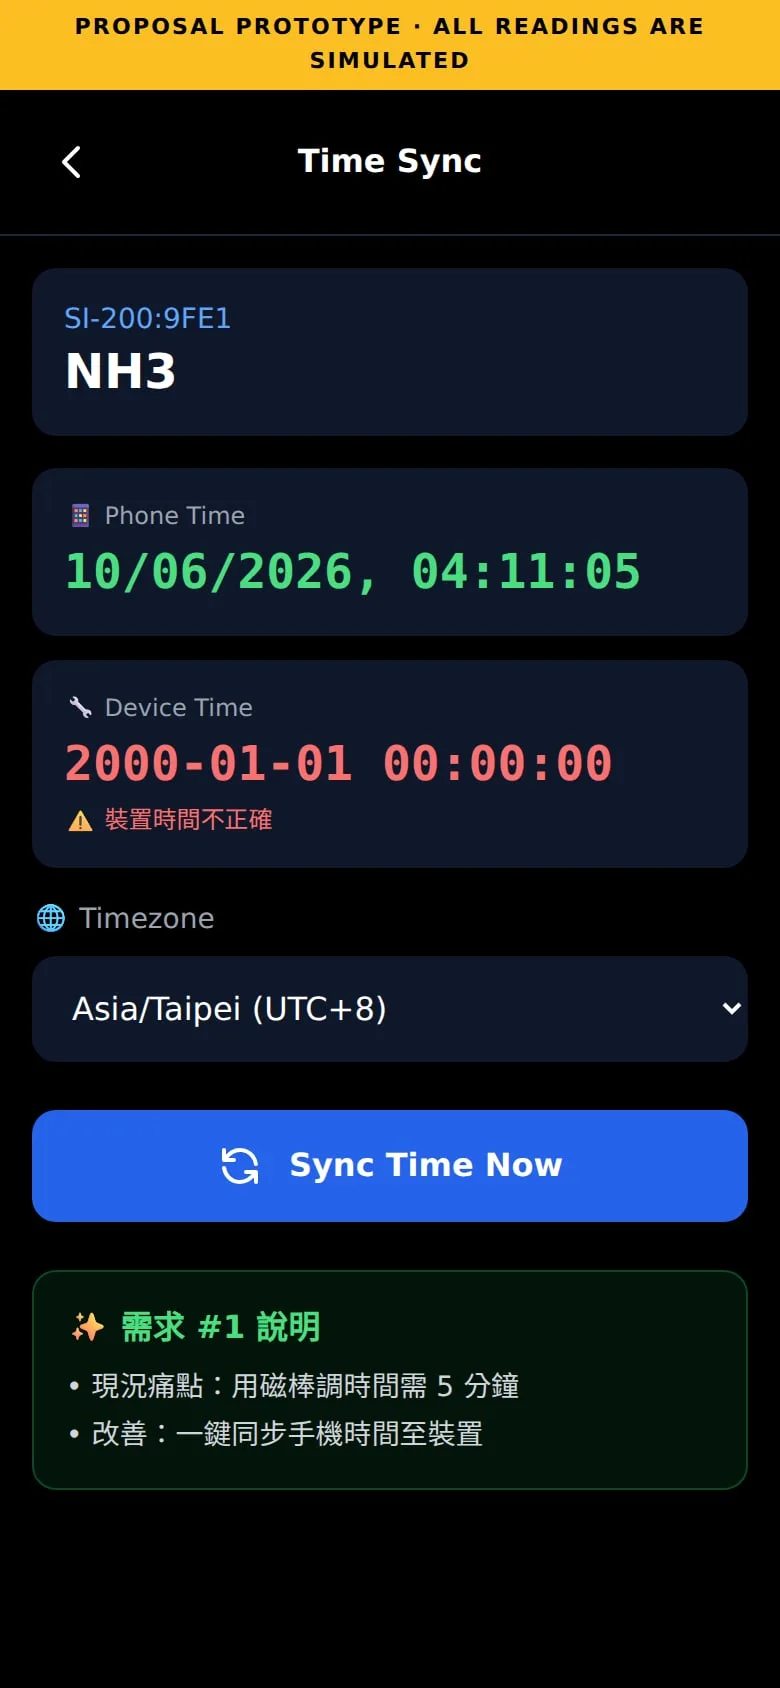
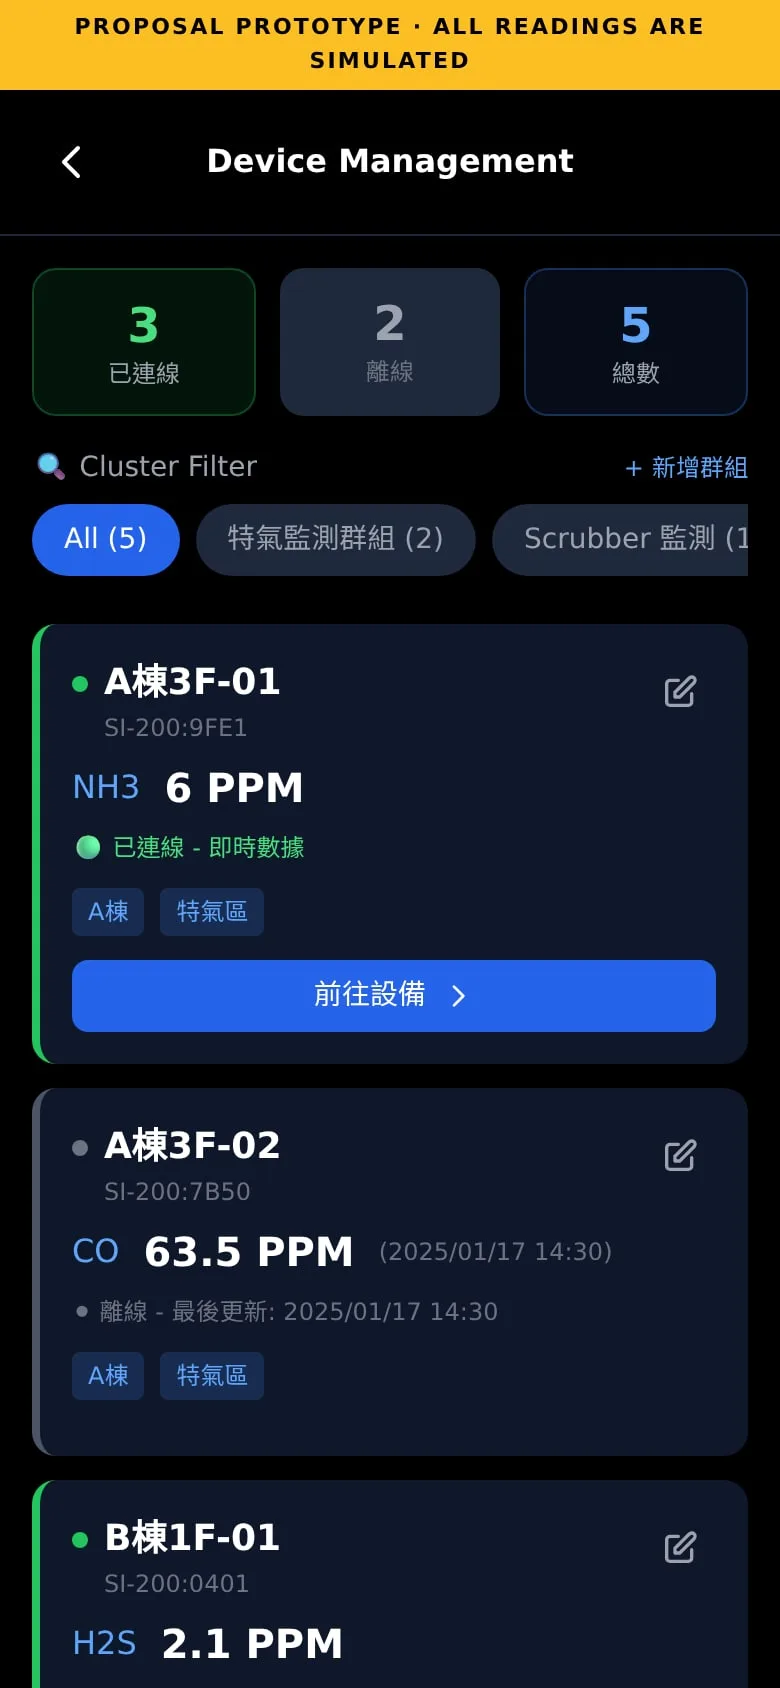
Setting a detector’s time meant entering year to second by hand with a magnetic stylus. I made it one tap that sends the phone’s time over Bluetooth. Calibration had no countdown timer, so engineers watched the clock; the prototype counts down both phases, stabilization and then calibration. Naming, tagging and grouping devices became short, guided flows.
- CONTEXT
- B2B gas-detection distributor, one-person product team; bilingual proposal (English / Korean) written for the Korean manufacturer
- STACK
- React (single-file prototype)
- DATA
- All readings are simulated.